Social Icons

Sunday, October 04, 2015

Extracting Username/Passwords from RAM Dump : Volatility Framework makes it Easy

1.  For those of you who have started reading this post coz of the tempting post title claiming extracting username/passwords from a RAM Dump,I must assure you it is possible easily in few steps using Volatility Framework.In the post ahead I have a RAM dump of a Windows 7 OS and I have been able to extract the user names and passwords of these users in three simple steps using Volatility Framework.Well,I will quickly get to the steps with screenshots :

Setup Required

 - Volatility Framework Installed.
[How to Install at http://anupriti.blogspot.in/2015/09/volatility-advanced-memory-forensics.html]

- Taking Ram Dump from Windows
[How to take RAM dump at para 3 of http://anupriti.blogspot.in/2015/09/volatility-command-using-imageinfo-to.html]

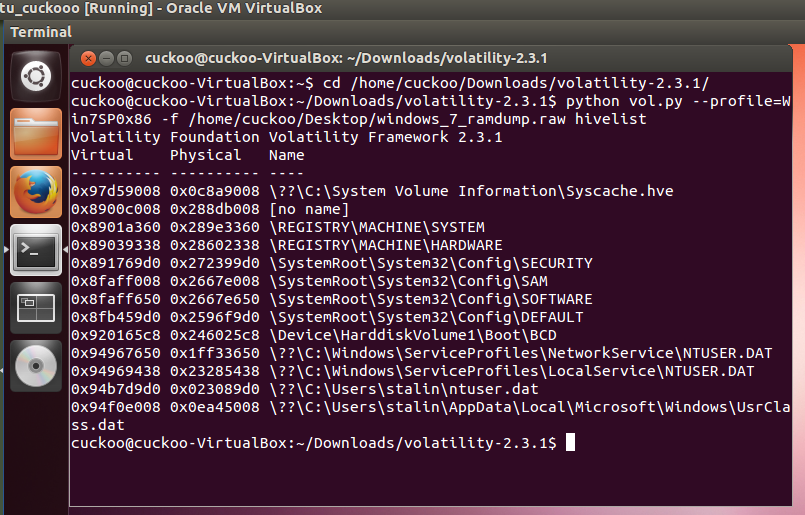
Here I am using two commands basically ie hivelist and hashdump

HIVELIST


Hivelist is used to locate the virtual addresses of registry hives in memory, and the full paths to the corresponding hive on disk.

Command Usage

python vol.py --profile=Win7SP0x86 -f /home/cuckoo/Desktop/windows_7_ramdump.raw hivelist

You get a similar output as seen below :
CLICK TO ENLARGE

Note Virtual Address for SYSTEM as highlighted
CLICK TO ENLARGE

Note Virtual Address for SAM as highlighted
CLICK TO ENLARGE

HASHDUMP


Hashdump is used to extract and decrypt cached domain credentials stored in the registry.

Command Usage

To use hashdump, pass the virtual address of the SYSTEM hive as -y and the virtual address of the SAM hive as -s, as shown below:

python vol.py --profile=Win7SP0x86 hashdump -f /home/cuckoo/Desktop/windows_7_ramdump.raw -y 0x8901a360 -s 0x8faff008

Hashdump output seen with user names and NTLM dump
CLICK TO ENLARGE
As we see vide above screen shot we have been able to extract names of users as stalin,VOLA and TILITY with hash of passwords against their names.Now we will decrypt these hashes.

DECRYPTING NTLM hash

Now comes decrypting this hash as we have got vide hashdump above.Hashes can now be cracked using John the Ripper, rainbow tables, etc.Now no need to install these crackers separately.Simply google for online decryptos and you will get the password too.I used this site at http://www.hashkiller.co.uk/ntlm-decrypter.aspx

Screen shots below:

Password extracted is test_1234
CLICK TO ENLARGE

Password extracted is test_123
CLICK TO ENLARGE

Password extracted is test
CLICK TO ENLARGE
So in all two terminal commands running volatility hivelist and hashdump followed by decrypting the hash online will give you the usernames and passwords from the RAM dump.Any queries and questions or advises are most welcome.Thanks

Thursday, October 01, 2015

Burp Suite : Configuring the browser and redirecting traffic

1.   Vide my last post about installing Burp Suite here ,now I move ahead to configure your browser in order to redirect all HTTP/S requests through Burp Proxy, instead of the actual target website. In my case here I am configuring a Mozilla Browser with proxy host address to 127.0.0.1 and the proxy port to 8080 , for both HTTP and HTTPS.The typical configuring of browsers is more or less common with major browsers with minor differences in interfaces.Here next I place you screen shots as I surfed a redirected traffic both for http and https via Burp Suite.First steps to configure Mozilla followed by screen shots :

Configuring Mozilla Firefox

- Click Firefox menu and then Preferences.
- In the Advanced options, under the Network tab, click on connection Settings.
- Select Manual proxy configuration.
- Enter the proxy host address as 127.0.0.1 and the proxy port as 8080.
- Select Use this proxy server for all protocols.
- Make sure to remove all exceptions from the No Proxy for field.
- Click OK and close.


2.   So now you have a working installation of Burp Suite and your browser is properly configured to intercept all requests.Now to test go to the browser, enter any http://www.****** site in the address bar and press Enter . If all is well, Burp Proxy should intercept this request. In Burp Suite,go to the Proxy and Intercept tab and verify that the web request is waiting for your approval.Ensure tha the Intercept on button is enabled; click on it and allow the request to transit through Burp by pressing Forward in Burp Suite Interface. Now in the browser, you should see the http page you entered in address bar.

Now try a https site and you are bound to see this warning as seen below in the screenshot.You will be presented with a This Connection is Untrusted page.In such a case, you are required to manually approve the connection by clicking on I Understand The Risks, then Add Exceptions... and Confirm Security Exception. To make sure that Burp Proxy is actually causing the warning, you click on the certificate status View... and see that the certificate belongs to PortSwigger CA as seen below in one screenshot.

 PortSwigger CA certificate


This setup means that Burp Suite is now ready for use as the traffic is being redirected as desired as per configuration....

Monday, September 28, 2015

Burp Suite : Integrated platform for Web Application Security

1.   Burp Suite is an excellent easy-to-use integrated platform for web application security that includes multiple tools seamlessly integrated to test every component and aspect of modern web applications. Whether you need to verify the robustness of your authentication mechanism, the predictability of your session tokens, or the input validation checkpoints present in your application, Burp is often compared to Swiss-army knife for security practitioners since it offers a horde of features . Not only does it allow in-depth manual assessments, but it also combines automated techniques to enumerate and analyze web application resources.Burp has been developed by PortSwigger Ltd. and is available in two editions:

- Burp Free
- Burp Professional

In-fact,the free version is perfect to start for beginners as it contains all the basic tools to find at least few first vulnerabilities.In its simplest way to explain, Burp is a local web proxy that allows to intercept, inspect, and modify HTTP/S requests and responses between the user's browser and the target website. While the user navigates through the web application, the tool acquires details on all visited pages, scripts,parameters, and other components. The traffic between the browser and the server can be eventually visualized, analyzed, modified, and repeated multiple times. The different tools included in Burp Suite can be easily distinguished by the upper tabs:

- Proxy: It allows to intercept and modify all web traffic.
- Target: This tool allows to aggregate all web application resources, thus guiding the user throughout the security test.
- Scanner: A complete web application security scanner, available in the Professional version only.
- Intruder: Burp Intruder allows to customize and automate web requests. 
- Spider: Automatic crawler that can be used to discover new pages and parameters.
- Sequencer: Used for verifying the randomness and predictability of security tokens, cookies, and more.
- Decoder: It allows to encode and decode data using multiple encoding schemes 
- Comparer: A visual diff tool that can be used to detect changes between web pages.
- Repeater: A simple yet powerful tool that can be used to manually modify and re-issue web requests.

How to go about Installation ?


- A minimum disk space of at least 200 MB is required.
- Required memory is at least 1 GB
- Burp Suite works on Windows, Mac OS X, and Linux
- Software components: An updated Oracle Java Runtime Environment is required to run Burp Suite. 

Downloading Burp Suite from ?


In the download folder where typically this file gets downloaded,create a burpsuite folder and mov this file to this folder for executing.

Launching Burp Suite in Linux


At the terminal type the following inside the pwd as the new burpsuite folder u created above :

java -Xmx2g -jar burpsuite_v1.4.01.jar


Volatility Framework Command : Using dlllist - dlldump to extricate DLLfile details

 This post will share an example to run the two volatility terminal commands including dllllist and dlldump  to display a process's loaded DLLs.

Before I proceed ahead,I would assume that you have installed volatility in your Linux system(in my case I am using UBUNTU, Installation explained at my earlier post at http://anupriti.blogspot.in/2015/09/volatility-advanced-memory-forensics.html) and you have a RAM dump of the OS u desire to analyse.In my case here I have taken the RAM dump of a Windows 7 OS as explained here at http://anupriti.blogspot.in/2015/09/volatility-command-using-imageinfo-to.html

dlllist

dlllist is used to display a process's loaded DLLs.DLLs are automatically added to this list when a process calls LoadLibrary (or some derivative such as LdrLoadDll).

vol.py --profile=Win7SP0x86 -f windows7_image.raw dlllist
To display the DLLs for a specific process instead of all processes, there is option to use the switch -p or --pid filter as shown below:

vol.py --profile=Win7SP0x86 -f windows7_image.raw dlllist --pid=1892

To display the DLLs for a process that is hidden or unlinked by a rootkit, first use the psscan to get the physical offset of the EPROCESS object and then:

vol.py --profile=Win7SP0x86 -f windows7_image.raw dlllist --offset=0x04a291a8
(Click on the image to ENLARGE)

dlldump

dlldump command is used to extract a DLL from a process's memory space and dump it to disk for analysis.The syntax is nearly the same as what has been seen earlier with any command.This plugin provisions the following :

- Dump all DLLs from a hidden/unlinked process (with --offset=OFFSET)
- Dump all DLLs from a specific process (with --pid=PID)
- Dump all DLLs from all processes
- Dump a PE from anywhere in process memory (with --base=BASEADDR), this option is useful for extracting hidden DLLs

To specify an output directory, use --dump-dir=DIR or -d DIR.

vol.py --profile=Win7SP0x86 -f windows7_image.raw dlldump --dump-dir output

where output is the name of directory where u get the dll dump


the output directory will be seen as seen below :


More at : https://code.google.com/p/volatility/wiki/CommandReference#dlllist

Sunday, September 27, 2015

Volatility Framework Command : Using pslist - pstree - psscan to identify process details from mem dump

This post will share an example to run the three volatility terminal commands including pslist, pstree and psscan

Before I proceed ahead,I would assume that you have installed volatility in your Linux system(in my case I am using UBUNTU,Installation explained at my earlier post at http://anupriti.blogspot.in/2015/09/volatility-advanced-memory-forensics.html) and you have a RAM dump of the OS u desire to analyse.In my case here I have taken the RAM dump of a Windows 7 OS as explained here at http://anupriti.blogspot.in/2015/09/volatility-command-using-imageinfo-to.html

Usage as follows :

pslist

The command pslist will be useful for any forensic prelim inquiry to find out the processes being run on the pc at the likely time of incident.The pslist command is used to list the processes of a system and it does not detect hidden or unlinked processes."pslist" module utilizes the same algorithm as the tasklist command that would be executed on the live computer. And also, Windows Task Manager uses the same approach as well.The command "pslist" traverses the list of active process structures that the Windows kernel maintains.The screen shot below shows a task manager activity of a windows PC i am using for test.Subsequently I have taken a fresh dump at this time and then analysed this dump with volatility on UBUNTU to find the process details which actually come out as the same as seen in the screenshots below :

Windows TASK MANAGER as seen in Windows OS
(CLICK TO ENLARGE)
The command usage at terminal syntax goes like this :
vol.py --profile=Win7SP0x86 -f windows_memory.raw pslist

Click on image to ENLARGE

Click on image to ENLARGE
 [TRIM]
Click on image to ENLARGE
 [TRIM]

The columns display the offset, process name, process ID, the parent process ID, number of threads, number of handles, and date/time when the process started. The offset is a virtual address by default, but the physical offset can be obtained with the -P switch as seen in the command below with screenshot.

vol.py --profile=Win7SP0x86 -f windows_memory.raw pslist -P

(Output with -P Switch)
Click on image to ENLARGE

pstree

pstree command is used to view the process listing in tree form and enumerates processes using the same technique as pslist, so it will also not show hidden or unlinked processes. Child process are indicated using indention and periods.SCreen shot of output and syntax as below :

vol.py --profile=Win7SP0x86 -f windows_memory.raw pstree

Click on image to ENLARGE

 psscan

psscan is used to enumerate processes by pool tag scanning and can find processes that previously terminated (inactive) and processes that have been hidden or unlinked by a rootkit. Syntax and screenshot of output as follows:

vol.py --profile=Win7SP0x86 -f win7.dmp psscan

Click on image to ENLARGE


Friday, September 25, 2015

Volatility Command : Using kdbgscan/kprcscan to scan for potential KDBG/KPCR structures

This post will share an example to run the two volatility terminal commands including kdbgscan and kprcscan.

Before I proceed ahead,I would assume that you have installed volatility in your Linux system(in my case I am using UBUNTU) (Installation explained at my earlier post at http://anupriti.blogspot.in/2015/09/volatility-advanced-memory-forensics.html) and you have a RAM dump of the OS u desire to analyse.In my case here I have taken the RAM dump of a Windows 7 OS as explained here at http://anupriti.blogspot.in/2015/09/volatility-command-using-imageinfo-to.html

Basic intro about these two commands :

kdbgscan

This command is used to scan for potential KDBG structures and is meant to positively identify the correct profile of the system and the correct KDBG (kernel debugger block) address. It simply scans for KDBG header signatures linked to the profiles in Volatility.

Usage : 

python vol.py --profile=Win7SP0x86 -f filename.raw kdbgscan

Screen shot executing the above command shown below :
(CLICK TO ENLARGE)
kpcrscan

This command is used to scan for potential KPCR(Kernel Processor Control Region) structures. A KPCR is a data structure used by the kernel to store the processor-specific data. Kpcrscan searches for and dumps potential KPCR values. On a multi-core system, each processor has its own KPCR. Therefore, ideally  one should see at least as many KPCR addresses as there are processors on the machine from which the memory dump was acquired.Usage as follows :

python vol.py --profile=Win7SP0x86 -f win_image.raw kpcrscan

Screen shot with output as below :
(CLICK ON IMAGE TO ENLARGE)


Volatility Command : Using IMAGEINFO to find type of System Image

1.   After installing Volatility as I gave details in my post here,next we need to start exploiting the power of Volatility.In my next posts ahead I would decipher usage of the general commands used for Volatility.To start with I initiate with IMAGEINFO command whose output tells the suggested profile that you should pass as the parameter to --profile=PROFILE; there may be more than one profile suggestion if profiles are closely related. One can figure out which one is more appropriate by checking the "Image Type" field, which is blank for Service Pack 0 and filled in for other Service Packs.

2.  Next few screen-shots show how I have taken the RAM dump of Windows 7 OS with the help of DUMPIT utility that I downloaded from here.Dumpit vastly simplifies memory acquisition. Effectively Dumpit combines win32dd and win64dd into one tool and is so simple to use even a non-technical user could do acquisition from a USB key. The dump can then be analyzed using VOLATILITY.

3.   Firstly,I show u the windows screen here with the Dumpit file on desktop which I simply click one to get the dump.
 I get the following screen and I click YES
 Further yes to the command prompt screen starts the dump download as seen below :
 I get a success message here and the dump is ready for analysis.
 The .raw file that is generated,I move it to ubuntu for analysis which has Volatility installed.At the terminal I type the command as :
python vol.py -f file_name.raw imageinfo


and in a few minutes I get the profile suggested as Win7SP0x86 / Win7SP1x86

Thursday, September 24, 2015

[SOLVED] : Failed to load unit 'HGCM' (VERR_INVALID_PARAMETER)

In one of the recent updates of Virtual Box I got this error on start of the saved state of virtual machine.The error said :

Failed to load unit 'HGCM' (VERR_INVALID_PARAMETER)

The resolve is simple ,no stunts involved, as follows :


Simply right click on the machine and choose "DISCARD SAVED STATE"

Thats it...restart the machine,it should resolve.

Wednesday, September 23, 2015

[SOLVED]: /sbin/mount.vboxsf mounting failed with the error protocol error ubuntu

1. It had never happened in recent past and every time I used to mount the share folder for the guest OS in virtual box it used to happen vide this command :

sudo mount.vboxsf sharedfolder /mnt/foldername

where sharedfolder is the new folder you have created inside guest OS home directory in virtual box ~ ie /home to be mounted with another folder from host OS as foldername here

but today it showed an error with the following message :

/sbin/mount.vboxsf mounting failed with the error protocol error
as seen below :


tried everything around with the commands but didn't get resolved before I attempted to do the more simpler thing of going to the pwd of the folder where I created it to be mounted and typed the same command without path

surprisingly it worked!!!!


Tuesday, September 22, 2015

Volatility-Advanced Memory Forensics Framework : Installation@Ubuntu

1.   The Volatility Framework is a completely open collection of tools, implemented in Python for the extraction of digital artifacts from volatile memory (RAM) samples. Volatility is a memory forensics framework, to analyse ram memory dumps for Windows, Linux, and Mac. In order to analyse a operating system’s RAM memory in Volatility, you need to build the corresponding operating system’s profile.The extraction techniques are performed completely independent of the system being investigated but offer unprecedented visibility into the runtime state of the system. The framework is intended to introduce people to the techniques and complexities associated with extracting digital artifacts from volatile memory samples and provide a platform for further work into this exciting area of research.Vide this post, I am sharing how to install volatility in Ubuntu 12.04 in a step wise manner.The post includes screen-shots and ready to shoot terminal commands for installing other dependent libraries.

Firstly : Installing Dependencies

sudo apt-get install subversion pcregrep libpcre++-dev python-dev -y

Secondly : Installing PyCrypto

First download PyCRypto from https://ftp.dlitz.net/pub/dlitz/crypto/pycrypto/pycrypto-2.6.1.tar.gz

Go to ~/..../Downloads/

tar -zxvf pycrypto-2.6.1.tar.gz

cd pycrypto-2.6.1

python setup.py build

sudo python setup.py build install


Thirdly: Installing Distrom
Distrom ,a disassemble library for x86/AMD64 can be downloaded from https://github.com/gdabah/distorm

Goto downloads where the file is likely downloaded :

unzip distorm3.zip

cd distorm3/

python setup.py build

python setup.py build install

Fourthly: Installing Yara 

Volatility needs another important dependency known as Yara,that can be installed as follows:

wget http://yara-project.googlecode.com/files/yara-1.4.tar.gz

tar -zxvf yara-1.4.tar.gz

cd yara-1.4/

sudo ./configure

sudo make

sudo make install


Fifthly : Installing Yara-Python


Download the tar.gz from https://yara-project.googlecode.com/files/yara-python-1.4a.tar.gz

tar -zxvf yara-python-1.4a.tar.gz

cd yara-python-1.4a/

python setup.py build

python setup.py build install

sudo echo “/usr/local/lib” >> /etc/ld.so.conf

sudo ldconfig
Now through with the installation of dependencies,we go ahead to install Volatility after we download the tar ball from https://code.google.com/p/volatility/downloads/detail?name=volatility-2.3.1.tar.gz&can=2&q=


~/Desktop/F0r3ns1c5/Memory_Forensics/New/volatility-2.3.1$ python setup.py build

~/Desktop/F0r3ns1c5/Memory_Forensics/New/volatility-2.3.1$ python setup.py build install

The installation is complete now and you should get a similar screen as seen below on running the command python vol.py -h
Powered By Blogger