Social Icons

Sunday, September 27, 2015

Volatility Framework Command : Using pslist - pstree - psscan to identify process details from mem dump

This post will share an example to run the three volatility terminal commands including pslist, pstree and psscan

Before I proceed ahead,I would assume that you have installed volatility in your Linux system(in my case I am using UBUNTU,Installation explained at my earlier post at http://anupriti.blogspot.in/2015/09/volatility-advanced-memory-forensics.html) and you have a RAM dump of the OS u desire to analyse.In my case here I have taken the RAM dump of a Windows 7 OS as explained here at http://anupriti.blogspot.in/2015/09/volatility-command-using-imageinfo-to.html

Usage as follows :

pslist

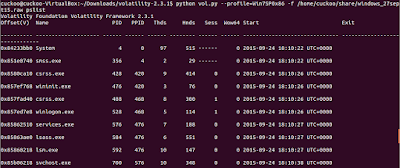
The command pslist will be useful for any forensic prelim inquiry to find out the processes being run on the pc at the likely time of incident.The pslist command is used to list the processes of a system and it does not detect hidden or unlinked processes."pslist" module utilizes the same algorithm as the tasklist command that would be executed on the live computer. And also, Windows Task Manager uses the same approach as well.The command "pslist" traverses the list of active process structures that the Windows kernel maintains.The screen shot below shows a task manager activity of a windows PC i am using for test.Subsequently I have taken a fresh dump at this time and then analysed this dump with volatility on UBUNTU to find the process details which actually come out as the same as seen in the screenshots below :

Windows TASK MANAGER as seen in Windows OS
(CLICK TO ENLARGE)
The command usage at terminal syntax goes like this :
vol.py --profile=Win7SP0x86 -f windows_memory.raw pslist

Click on image to ENLARGE

Click on image to ENLARGE
 [TRIM]
Click on image to ENLARGE
 [TRIM]

The columns display the offset, process name, process ID, the parent process ID, number of threads, number of handles, and date/time when the process started. The offset is a virtual address by default, but the physical offset can be obtained with the -P switch as seen in the command below with screenshot.

vol.py --profile=Win7SP0x86 -f windows_memory.raw pslist -P

(Output with -P Switch)
Click on image to ENLARGE

pstree

pstree command is used to view the process listing in tree form and enumerates processes using the same technique as pslist, so it will also not show hidden or unlinked processes. Child process are indicated using indention and periods.SCreen shot of output and syntax as below :

vol.py --profile=Win7SP0x86 -f windows_memory.raw pstree

Click on image to ENLARGE

 psscan

psscan is used to enumerate processes by pool tag scanning and can find processes that previously terminated (inactive) and processes that have been hidden or unlinked by a rootkit. Syntax and screenshot of output as follows:

vol.py --profile=Win7SP0x86 -f win7.dmp psscan

Click on image to ENLARGE


Friday, September 25, 2015

Volatility Command : Using kdbgscan/kprcscan to scan for potential KDBG/KPCR structures

This post will share an example to run the two volatility terminal commands including kdbgscan and kprcscan.

Before I proceed ahead,I would assume that you have installed volatility in your Linux system(in my case I am using UBUNTU) (Installation explained at my earlier post at http://anupriti.blogspot.in/2015/09/volatility-advanced-memory-forensics.html) and you have a RAM dump of the OS u desire to analyse.In my case here I have taken the RAM dump of a Windows 7 OS as explained here at http://anupriti.blogspot.in/2015/09/volatility-command-using-imageinfo-to.html

Basic intro about these two commands :

kdbgscan

This command is used to scan for potential KDBG structures and is meant to positively identify the correct profile of the system and the correct KDBG (kernel debugger block) address. It simply scans for KDBG header signatures linked to the profiles in Volatility.

Usage : 

python vol.py --profile=Win7SP0x86 -f filename.raw kdbgscan

Screen shot executing the above command shown below :
(CLICK TO ENLARGE)
kpcrscan

This command is used to scan for potential KPCR(Kernel Processor Control Region) structures. A KPCR is a data structure used by the kernel to store the processor-specific data. Kpcrscan searches for and dumps potential KPCR values. On a multi-core system, each processor has its own KPCR. Therefore, ideally  one should see at least as many KPCR addresses as there are processors on the machine from which the memory dump was acquired.Usage as follows :

python vol.py --profile=Win7SP0x86 -f win_image.raw kpcrscan

Screen shot with output as below :
(CLICK ON IMAGE TO ENLARGE)


Volatility Command : Using IMAGEINFO to find type of System Image

1.   After installing Volatility as I gave details in my post here,next we need to start exploiting the power of Volatility.In my next posts ahead I would decipher usage of the general commands used for Volatility.To start with I initiate with IMAGEINFO command whose output tells the suggested profile that you should pass as the parameter to --profile=PROFILE; there may be more than one profile suggestion if profiles are closely related. One can figure out which one is more appropriate by checking the "Image Type" field, which is blank for Service Pack 0 and filled in for other Service Packs.

2.  Next few screen-shots show how I have taken the RAM dump of Windows 7 OS with the help of DUMPIT utility that I downloaded from here.Dumpit vastly simplifies memory acquisition. Effectively Dumpit combines win32dd and win64dd into one tool and is so simple to use even a non-technical user could do acquisition from a USB key. The dump can then be analyzed using VOLATILITY.

3.   Firstly,I show u the windows screen here with the Dumpit file on desktop which I simply click one to get the dump.
 I get the following screen and I click YES
 Further yes to the command prompt screen starts the dump download as seen below :
 I get a success message here and the dump is ready for analysis.
 The .raw file that is generated,I move it to ubuntu for analysis which has Volatility installed.At the terminal I type the command as :
python vol.py -f file_name.raw imageinfo


and in a few minutes I get the profile suggested as Win7SP0x86 / Win7SP1x86

Thursday, September 24, 2015

[SOLVED] : Failed to load unit 'HGCM' (VERR_INVALID_PARAMETER)

In one of the recent updates of Virtual Box I got this error on start of the saved state of virtual machine.The error said :

Failed to load unit 'HGCM' (VERR_INVALID_PARAMETER)

The resolve is simple ,no stunts involved, as follows :


Simply right click on the machine and choose "DISCARD SAVED STATE"

Thats it...restart the machine,it should resolve.

Wednesday, September 23, 2015

[SOLVED]: /sbin/mount.vboxsf mounting failed with the error protocol error ubuntu

1. It had never happened in recent past and every time I used to mount the share folder for the guest OS in virtual box it used to happen vide this command :

sudo mount.vboxsf sharedfolder /mnt/foldername

where sharedfolder is the new folder you have created inside guest OS home directory in virtual box ~ ie /home to be mounted with another folder from host OS as foldername here

but today it showed an error with the following message :

/sbin/mount.vboxsf mounting failed with the error protocol error
as seen below :


tried everything around with the commands but didn't get resolved before I attempted to do the more simpler thing of going to the pwd of the folder where I created it to be mounted and typed the same command without path

surprisingly it worked!!!!


Powered By Blogger